 | Consumer Metrics Institute News Feed Subscribe to Consumer Metrics Institute News by Email |
Consumer Metrics Institute
Home of Daily Consumer Leading Indicators
| Consumer Metrics InstituteHome of Daily Consumer Leading Indicators |
| Home | History | Automotive | Entertainment | Financial | Health | Household | Housing | Recreation | Retail | Technology | Travel | FAQs | Downloads | Membership | Contact | About |
October 26, 2010 - Current Contraction Surpasses "Great Recession"
Commentary:On October 20, 2010 the aggregate severity of the 2010 contraction in consumer demand surpassed the similar measure of economic pain experienced during the "Great Recession." And a glance at our "Contraction Watch" tells us that the pain is not about to end anytime soon:
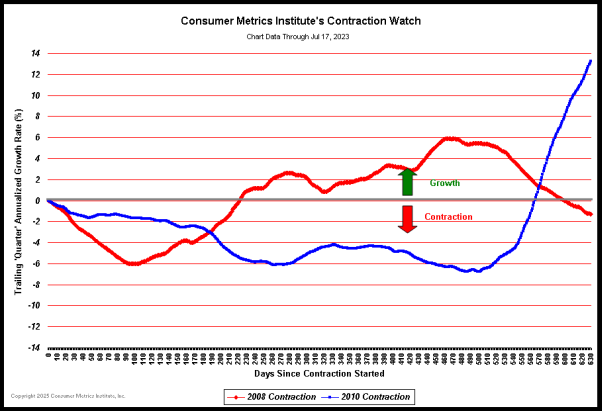 (Click on chart for fuller resolution) In the above chart, the day-by-day courses of the 2008 and 2010 contractions are plotted in a superimposed manner, with the plots aligned on the left margin at the first day during each event that our Daily Growth Index went negative. The plots then progress day-by-day to the right, tracing out the changes in the daily rate of contraction in consumer demand for the two events. The true severity of any contraction event is the area between the "zero" axis in the above chart and the line being traced out by the daily contraction values. By that measure the "Great Recession of 2008" had a total of 793 percentage-days of contraction over the course of 221 days, whereas the current 2010 contraction has reached 820 percentage-days over the course of 282 days -- without yet clearly forming a bottom. The damage to the economy is already 3% worse than in 2008, and the 2010 contraction has lasted 28% longer than the entire 2008 event without yet starting to recover. We have constructed a new chart to assist in the visualization of the "percentage-days" severity of the two contraction events: 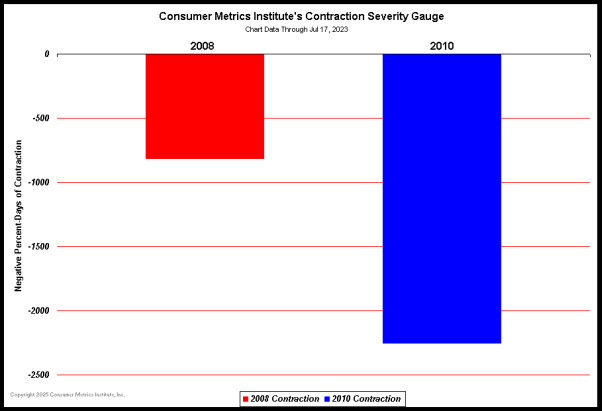 (Click on chart for fuller resolution) In the above chart the red vertical bar represents the -793 percentage-days of contraction in consumer demand that we measured in 2008. The blue vertical bar represents the same measure (to date) for the 2010 event. But since the 2010 event is not yet over, we have projected the eventual full extent of the 2010 event with the purple vertical bar. That projection is an average of several recovery scenarios, all of which conservatively assume that the bottom has already been reached. Meanwhile, we are left to wonder if a bottom as been forming in the current contraction. A detailed view of our Daily Growth Index over the past 60 days could be viewed as either encouraging or simply "more of the same," depending on your state of mind: 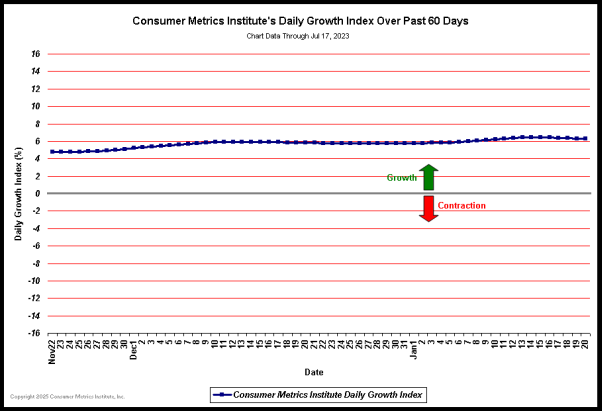 (Click on chart for fuller resolution) It is important to remember that our Daily Growth Index is a moving 91-day "trailing quarter" average for our Weighted Composite Index (converted from a nominal base-100 index into a year-over-year percentage change). As such it responds to the values of both the newest day's Weighted Composite Index (just entering the 91-day average for the first time) and the 92nd day back -- which has just fallen out of the average. The current values of the Weighted Composite Index are in the -5% to -7% range, whereas the oldest days falling out of the average reflect a weaker period in late July when the Weighted Composite Index was in the -6% to -9% range. Even if current consumer demand remains relatively constant we should expect the trailing 91-day "trailing quarter" to improve slightly from recent record lows over the next 30 days. But we are unlikely to see significant improvements until the current values of the Weighted Composite Index move substantially above the zone between 94 and 96 -- which we consider unlikely until after the mid-term elections (see our comments on the impact of Political "FUD" for why we consider that unlikely). From time to time we have been asked whether we consider the current contraction in consumer demand to be the second "dip" in a "double dip" recession. From a qualitative perspective, we believe that the "Great Recession" is not so much a "double-dip" as a single "big-scoop" that changed character somewhere in the middle. We understand that the NBER says that the recession ended in June 2009. However quantitatively/technically correct that may be by NBER standards, by "Main Street" gut-feeling standards the NBER assertion is somewhere between questionable and ludicrous, depending on the personal circumstances of the observer. Our data indicates that the consumer portion of the "Great Recession" unfolded (and is still unfolding) along these lines: ► The recession most likely started with a drop in consumer confidence, triggered by bad financial news (Bear Stearns, Lehman Brothers, etc.) and media coverage of the "Housing Crisis"/sub-prime loans. ► The initial recessionary downturn was accelerated by political uncertainties in 2008 and rising energy prices. ► An organic recovery started late in 2008 when energy prices collapsed, lasting well into 2009 with help from short term stimuli ("Cash for Clunkers" and the Federal New Home Tax Credit). ► During 2009 (and now deeply into 2010) a ruthless corporate obsession with short term earnings exacerbated the already weak employment picture, even as equity markets recovered. ► By late summer 2009 consumers realized that this was not a “garden variety” recession, as unemployment persisted and fixed incomes plummeted. ► By early 2010 demographically appropriate “frugal” consumer habits had emerged, reducing discretionary spending in favor of increased personal savings (or the paying down of debt). The two reversals described above can be clearly seen in a chart of our trailing 183-day "two consecutive quarters" index -- which is designed to closely follow the "two consecutive quarters" definition of a recession -- for the past 48 months: 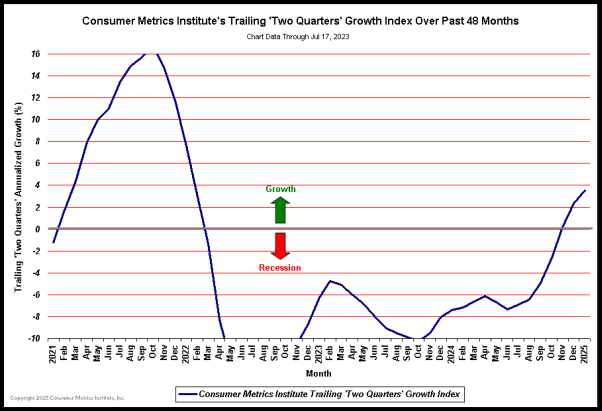 (Click on chart for fuller resolution) Credit the growth spurt in the middle of the above chart to a combination of dropping energy prices, consumer shopping reverting to form after a brief hiatus, positive psyches as a result of a honeymoon with the new administration, and the consumer oriented parts of the stimulus packages. All that changed when consumers realized (in late 2009) that things were not actually getting any better. But missing from the above narrative is the potential permanence of the damage inflicted on certain consumers. Those consumers living through foreclosures will have suffered lifestyle and financial reversals that may require a decade or longer to rehabilitate. And even those fortunate enough to stay current with their mortgages may have had their dreams of upward mobility (or mobility of any sort) crushed. In both of these cases the damage will have caused changes in habits (the "new frugality") that could last decades, if not the rest of their lives. The "Great Depression" of the 1930's changed an entire generation's attitudes about banks and spending permanently. While this economic strife may not be as severe, the emotional scars may persist longer than policy makers might wish. Also absent from the above narrative is the impact of the Federal Reserve's extended "zero rate" policy on those attempting to live on a lifetime's modest accumulation of wealth. On Wall Street and inside the Beltway there are no perceived victims of low interest rates, because low rates result in obscene spreads between the real cost of institutional borrowing (essentially zero) and the real rate of consumer lending (18% to 24% on real-world short term loans). Meanwhile every barrier possible has been raised to prevent those lower rates from propagating to those most in need of longer term relief. Lost on the policy makers is the fact that what's good for banks is not necessarily good for their depositors. Simply stated, it has become impossible to live on the earnings generated by a lifetime of middle class savings. In June 2007 an accumulation of $2,000,000 in an IRA or 401K would translate into $100,000 in annual income when invested in 1 year T-Bills, an annual income higher than the per capita income in any of the richest nations on earth. That was certainly a reasonable target for a middle class household, and one that would allow a comfortable retirement without significant changes in lifestyle. Today the same $2,000,000 (if it was somehow preserved throughout the "Great Recession") would earn $4,200 per annum if invested similarly -- or roughly the per capita income in the Republic of the Congo. No wonder that many "Baby Boomers" are increasing savings and postponing retirement to the chagrin of younger people desperately looking for jobs; the alternative is a third-world lifestyle. Sector: Title:October 5, 2010 - Inside the September GDP Revisions: The September GDP release from the Bureau of Economic Analysis ("BEA") contains only minor revisions to previously published data. The headline "third" estimate of the annualized rate of GDP growth was revised up to 1.7% from the August "second" estimate of 1.6%. To keep these numbers in perspective we need to look a little more closely at what the GDP tries to measure. The classic definition of the GDP can be summarized with the following equation: GDP = private consumption + gross private investment + government spending + (exports − imports) or, as it is commonly expressed in algebraic shorthand: GDP = C + I + G + (X-M) If we build a table around that equation -- showing each term's total dollars (rounded to the nearest $.1 trillion), each term's percentage of the total GDP, and each term's contribution to the final percentage growth number -- it might look something like this: GDP Table
Several of the numbers in the above table merit comment: ► "C" (consumer demand) represents over 70% of the entire U.S. economy. At an annualized $10.3 trillion dollars, it is the "800 pound gorilla" within the U.S. economy. ► Deteriorating (X-M) nearly offset the total positive growth contributions from the industrial and governmental sectors. This is a substantial change from the 4th quarter of 2009, when improvements in (X-M) added 1.9% to the final GDP growth number. ► "I" (Gross Private Investment) pulled the final GDP growth rate up by 2.9%. This is also a highly volatile component of the GDP growth rate, having recently swung as negative as -6.8% during the 1st quarter of 2009. ► Within "I" there is a subcomponent called "change in private inventories," which represents the adjustments that factories make to inventories in their supply chains. From the 1st quarter of 2010 to the 2nd quarter of 2010 that subcomponent dropped from a 2.6% contribution to the GDP growth to a .8% contribution. When consumer demand contracted in 2008 that number went as negative as -2.3% (during the 4th quarter of 2008). ► At the Consumer Metrics Institute we measure only a portion of the "C" in the above equation. In fact, we intentionally capture only the discretionary durable goods transactions of internet shopping consumers, a particularly volatile subset of "C." We don't track the core non-discretionary items that represent perhaps 90% of take-home pay: groceries, gasoline, utilities, non-discretionary medical expenses and current housing (and in a deleveraging world, you can add personal savings and/or debt retirement to that list). ► However, the particularly volatile subset of "C" that we do measure provides us with an amplified and leading signal; during the 2008 contraction our Daily Growth Index bottomed at about a -6.0% contraction rate, whereas the "C" measured by the BEA bottomed at a -2.46% rate -- giving our Daily Growth Index about a 2.4x signal "gain" factor. Our own headline for the end of September would be that both our Weighted Composite Index and our Daily Growth Index have turned down again. In fact, our Daily Growth Index has now reached a level exceeding the lowest level recorded during the "Great Recession of 2008": (Click on chart for fuller resolution) In the above chart, the day-by-day course of the 2008 and 2010 contractions are plotted in a superimposed manner, with the plots aligned on the left margin at the first day during each event that our Daily Growth Index went negative. The plots then progress day-by-day to the right, tracing out the changes in the daily rate of contraction in consumer demand for two events. The true severity of any contraction event is the area between the gray "zero" axis in the above chart and the line being traced out by the daily contraction values. By that measure the "Great Recession of 2008" had a total of 793 percentage-days of contraction over the course of 221 days, whereas the current 2010 contraction has already exceeded 690 percentage-days -- already over 87% as bad. And the 2010 contraction has already lasted for 261 days, 40 days longer than the entire 2008 event. Additionally, within the past week the 2010 event has reached levels of daily contraction worse than anything recorded in 2008. But looking ahead, should the 2010 event recover from its bottom exactly like the 2008 event did, it would still experience nearly another 490 percentage-days of contraction before ending -- resulting in a grand total of 1180 percentage-days of contraction for the 2010 event, fully 49% more severe than the "Great Recession of 2008." Our concern with the above argument is the implicit projection of the blue line "recovering" in a manner similar to the upswing seen in the 2008 contraction. The 2008 "recovery" was aided by stimuli unlike anything currently pending. And the 2008 "recovery" started with a background level of 6% unemployment. Furthermore, we don't expect any consumer driven U.S. economic miracles at least for the next 30 days -- until the results of the 2010 U.S. midterm elections are known. That should add nearly 150 percentage-days of contraction to the above totals before any "recovery" upswing could plausibly start, placing the economic consequences of the 2010 contraction at least 1.67 times the pain suffered in 2008. Looking at the chart above, the striking difference between 2008 and 2010 is the implied longevity of the current event. Projecting forward, we will probably see another 30 days of political "Fear, Uncertainty and Doubt" ("FUD") pushing the blue line laterally to the right. And when the blue line eventually starts back up, we face the real possibility that the plateau visible in the left half of the chart's blue line is the new consumer "norm," reflecting the realities of a deleveraging U.S. consumer. If that is true, the economy's "800 pound gorilla" will have gone on a serious diet. | ||||||||||||||||||||||||||||||||||||||||||