 | Consumer Metrics Institute News Feed Subscribe to Consumer Metrics Institute News by Email |
Consumer Metrics Institute
Home of Daily Consumer Leading Indicators
| Consumer Metrics InstituteHome of Daily Consumer Leading Indicators |
| Home | History | Automotive | Entertainment | Financial | Health | Household | Housing | Recreation | Retail | Technology | Travel | FAQs | Downloads | Membership | Contact | About |
| August 20, 2010 - Politics and the Economy; Cause and Effect: At the Consumer Metrics Institute we have a unique perspective on the economy. We measure consumer demand on a daily basis, providing nearly two orders of magnitude more resolution than the BEA's GDP releases. This is like moving from naked eye observations to using a lab-grade microscope. As a result we can see timing relationships that simply can't be seen in quarterly data. Last month the BEA revised their GDP readings for the 4th quarter of 2008, now over 18 months old. In so doing, they have reported for the first time (at least in their data) that the Great Recession's annualized "growth" rate bottomed in the 4th quarter of 2008, not the 1st quarter of 2009 as they had been telling us for over a year. Although it is always disconcerting to have history revised, this particular revision was hardly news to us, since our daily data has always recorded the Great Recession's absolute bottom occurring on November 5th, 2008:  (Click on chart for fuller resolution) November 5th, 2008 is also interesting for political reasons, occurring one day after the 2008 U.S. Presidential Election. In fact, the two worse days of consumer demand we have ever recorded were on November 5th and 6th, 2008, with a sharp rebound starting on November 7th -- substantially earlier than the BEA had previously reported and four months before the lagging equity markets finally bottomed. The daily time resolution within our data gives us a unique opportunity to document and quantify the impact of political events on consumer demand. The political uncertainty leading up to and immediately following the 2008 election is a glaringly obvious example. Three days after the election, the very worst of the "fear, uncertainty and doubt" ("FUD") had passed, and consumers resumed their earlier upward trending demand. The subsequent growth resulted in daily year-over-year net growth by the end of November and 10% daily year-over-year growth by Christmas:  (Click on chart for fuller resolution) The above chart of 52 weekly averages for our Weighted Composite Index (September 2008 through August 2009) shows that the sharp, downward political-uncertainty "blip" actually descended from an otherwise already upward trending baseline of consumer demand -- which had previously bottomed in August 2008 (coincident with the Democratic National Convention). Remember that our data only reflects consumer demand for discretionary durable goods. Even in uncertain times people buy groceries and gasoline. But increasing demand for discretionary durable goods is what grows the economy, and political uncertainty (or at least political high drama) spoils the collective consumer appetite for major purchases. If nothing else, the daily resolution in our data suggests that: ► In 2008 political "FUD" exacerbated (to at least some extent) the Great Recession. ► Any political "FUD" in the second half of 2010 might do the same thing to the current Great Recovery, such as it is. The bottom line? A good predictor for the course of the Great Recovery over the next 90 days might be whether U.S. politicians are collectively singing "Kumbayah" or "Eve of Destruction". Our Daily Growth Index has reached a year-over-year contraction rate of 5%, and it is rapidly closing the gap on the worst contraction rate observed during the 2008 Great Recession: 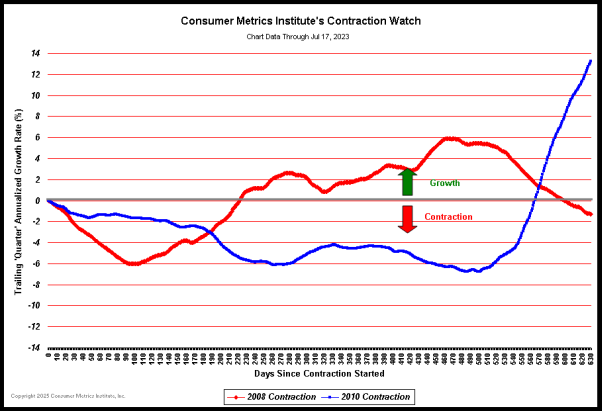 (Click on chart for fuller resolution) The current 2010 contraction is now over 215 days old. At the same point during the duration of the 2008 Great Recession, consumer demand was contracting at less than a 1% year-over-year rate. Additionally, during the 2008 Great Recession our Daily Growth Index had returned to net growth after 223 days. From the above chart we can see that the profile of the 2008 contraction and the 2010 contraction are substantially different. The 2008 event was a classic "V" shaped recession. So far this one is not. We have previously suggested that this contraction might be mild but prolonged. We are no longer confident about "mild". We have previously gained some notoriety for having our Daily Growth Index lead the GDP by a relatively consistent 18-20 weeks during the Great Recession. Does this mean that we expect the GDP a couple of quarters from now to be contracting at rates similar to our current -5% rate? ► Our methodologies capture only on-line consumer demand for discretionary durable goods, the most volatile portion of the consumer's 70% contribution to the GDP. As a consequence we are not seeing the impact of most ongoing governmental stimuli. If governmental stimulus packages can successfully offset the 2010 drop in consumer demand, the GDP might never feel the full weight of the 2010 contraction event. ► However, as we have said before, we suspect that consumers are the "800 pound gorilla" in this recession, and their actions (or inactions) will ultimately be felt to a major extent in the GDP. By analogy to (American) football statistics, we are only measuring the performance of the starting quarterback for the U.S. economic team. It is possible for a football team to win even though the quarterback is below average -- an overwhelming defense and a punishing running game can compensate for a journey-man quarterback -- but the performance of the starting quarterback is by far the best predictor of a football team's final results. The U.S. economy might grow without the U.S. consumer's support, but only with net exports and/or unsustainable governmental consumption. At the current time the likelihood of the U.S. becoming a net exporter is very low, and unsustainable governmental consumption is simply that: unsustainable. It is also helpful to distinguish between "leading" and "predicting"; we have deliberately decided to measure discretionary consumer demand data because it is highly leading, while fully realizing that the volatile data provides amplified signals. Fortunately during the 2008 recession the BEA's numbers for the full economy eventually matched the discretionary consumer demand portion (that we measure) with embarrassing accuracy. While we know that we are measuring only one portion of the economy -- the quarterback in the above analogy -- we still feel that those measurements reliably lead the economy as a whole. And they should not be expected to predict exactly what the BEA's 1937 based methodologies eventually measure -- for those portions of the economy that really mattered in 1937. As the saying goes: our numbers are what they are. They are pure daily measures of on-line consumer demand for discretionary durable goods. If consumer demand decisions initiate 70% of all U.S. commerce, we would like to measure that demand as far "upstream" as possible. | ||