(Click here for best resolution)
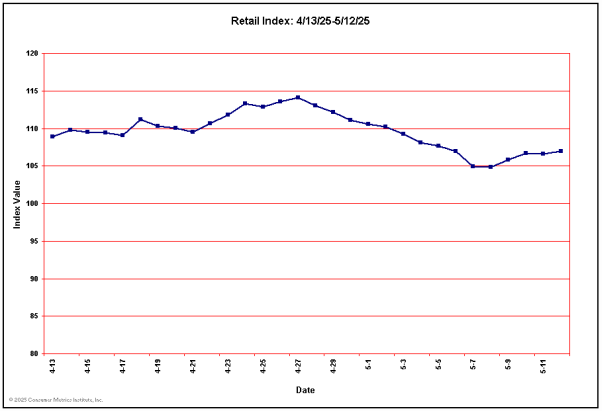
Last 10 Retail Index Values
| Date: | 10/15/2025 | 10/16/2025 | 10/17/2025 | 10/18/2025 | 10/19/2025 | 10/20/2025 | 10/21/2025 | 10/22/2025 | 10/23/2025 | 10/24/2025 |
| Value: | 141.81 | 141.40 | 140.62 | 139.65 | 139.04 | 140.00 | 140.07 | 140.41 | 142.36 | 142.95 |