(Click here for best resolution)
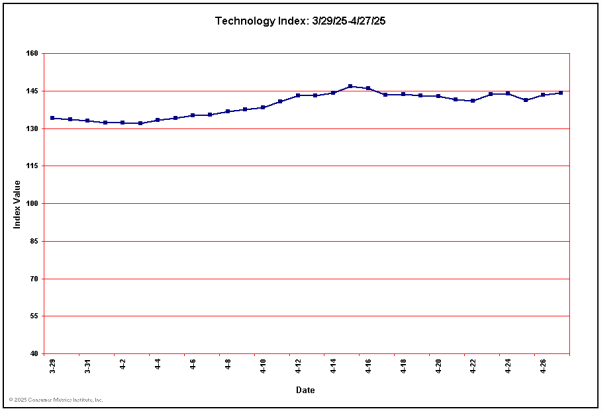
Last 10 Technology Index Values
| Date: | 10/15/2025 | 10/16/2025 | 10/17/2025 | 10/18/2025 | 10/19/2025 | 10/20/2025 | 10/21/2025 | 10/22/2025 | 10/23/2025 | 10/24/2025 |
| Value: | 131.58 | 131.47 | 131.85 | 131.02 | 130.77 | 131.71 | 131.74 | 132.14 | 132.78 | 133.03 |