 | July 13, 2010 - Behind the Credit Numbers:
During the past week there has been a flurry of Federal Reserve reports and commentary concerning the levels of credit in the current economy. The two most notable were:
► On July 8th they reported that the level of seasonally adjusted outstanding U.S. Consumer Credit (their G.19 report) decreased during May by $9.1 billion, representing an annualized rate of credit contraction of 4.5%. Although even this change is above the average for the preceding twelve months, it is much smaller than a quiet revision to the previously published April U.S. Consumer Credit figure -- which is now reported to have decreased by $14.9 billion (a 7.3% annualized contraction rate).
The Federal Reserve fails to put these numbers into perspective:
1) Consumer credit has contracted during 15 of the past 16 reported months, and it is down a record total $148 billion over that time span.
2) The $14.9 billion in credit 'lost' during just April is the second highest monthly amount in history, second only to the $23.4 billion 'lost' during November, 2009.
3) And the nearly 6% cumulative reduction in consumer credit over the past 16 months is the largest (on a percentage basis) for any 16 month span since September 1944 -- when FDR was still in the White House and people were buying War Bonds instead of tightly rationed consumer goods.
► On July 12th Federal Reserve Chairman Ben Bernanke noted that small businesses were not getting the loans that they need to create new jobs. The Federal Reserve's own data reports that lending to small businesses dropped to below $670 billion in Q1 2010, down about $40 billion (5.6%) from two years ago.
The New York Times reported Mr. Bernanke wondered: "How much of this reduction has been driven by weaker demand for loans from small businesses, how much by a deterioration in the financial condition of small businesses during the economic downturn, and how much by restricted credit availability? No doubt all three factors have played a role."
Small businesses, which account for over 60% of gross job creation, are not - for whatever reason - tapping into the credit necessary to create those jobs.
What does this mean?
1) The reported credit contraction is real, at historic levels and on-going.
2) Although the Federal Reserve does not yet know whether the most recent consumer credit contraction is the result of consumer pay-downs or credit company write-offs, the fact remains that spending and the money supply are both being impacted negatively as consumers and small businesses (voluntarily or not) clean up their balance sheets.
Why is this happening?
1) The Federal Reserve may have brought interest rates down to essentially zero for their friends on Wall Street, but they can not control the real costs of borrowing money in "Main Street" America. People with revolving credit card balances are paying 18% to 25% (or more) APR on those balances. Most people with fixed mortgages are paying 4% to 6% (or more) on their balances. Meanwhile, risk free demand deposits earn at least an order-of-magnitude less than revolving credit costs -- a historically low ratio.
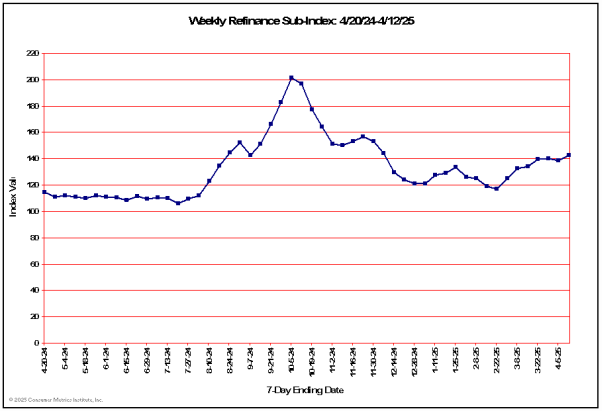
2) The one or two orders-of-magnitude spreads between "real world" risk-free earnings and short term borrowing costs are large enough to change behavior. U.S. consumers and small business owners are not idiots (or sheep, for that matter), and if presented with the opportunity to 'earn' (by avoidance) 18% and 25% per year totally risk free, they will chose to deleverage their short term debt. And for people without revolving credit card balances even 4% to 6% 'risk free' looks good, especially if they can refinance mortgages and lock in a lower rate in the process -- as our weekly refinancing index so vividly demonstrates.
The bottom line?
The Federal Reserve's ultra-low interest rates are driving down the risk-free earnings rates of real people without meaningfully reducing the costs of short term debt. The irony of all this is that the historically low Federal Reserve rates are actually causing rational consumers to deleverage, rewarding them with historic real-world spreads to contract their credit.
On July 6th we reported that the nearly relentless decline in our 'Daily Growth Index' had leveled off, but cautioned that the index should be viewed from a longer perspective. Since then the decline has resumed:
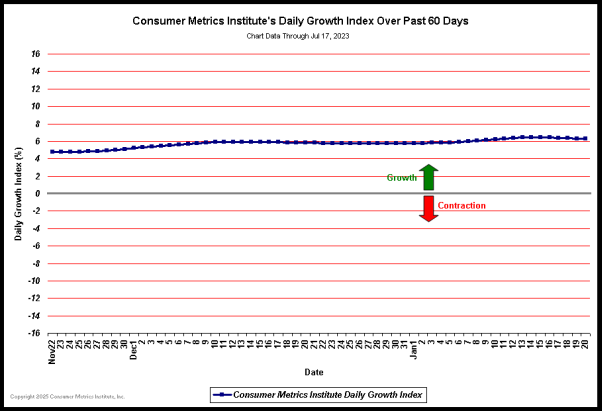
(Click on chart for fuller resolution)
When the most recent period of contraction in our 'Daily Growth Index' (January 15, 2010 to date) is charted along with the similar 'Daily Growth Index' contraction events from 2006 and 2008 (with the first day of each contraction aligned on the left-hand axis) the relative severity of each contraction can be visualized.
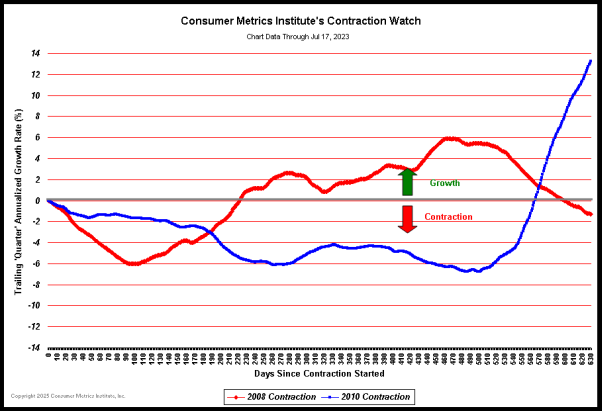
(Click on chart for fuller resolution)
One measure of the true severity of an economic slowdown is the 'area under the curve' (or 'above' the curve in this case) swept out by the 'Daily Growth Index' over time. This area is just the average magnitude of the decline times the duration of the contraction event. During the 2006 slowdown this area was about 136 percentage-days of contraction, while the 2008 event was much more severe at 793 percentage-days. The 2010 event has now reached 288 percentage-days, over twice the severity of 2006 and well over a third of 2008 'Great Recession' -- and it is still growing.
The key point to notice in the above chart is that if the current 2010 curve continues its current course, in about 20 days the 2010 slowdown will be more severe on a day-to-day basis than the 2008 'Great Recession' was at the same point in its respective evolution. Unless the economy begins to pick up quickly, a double dip is likely -- with the second round milder but lingering longer than the first.
| |
